Determination of distribution of diameters and electric conductivity properties
of samples of single wall carbon nanotubes manufactured by a given manufacturer in order to determine their fitness for production of conductive paper for electrochemical equipment applications
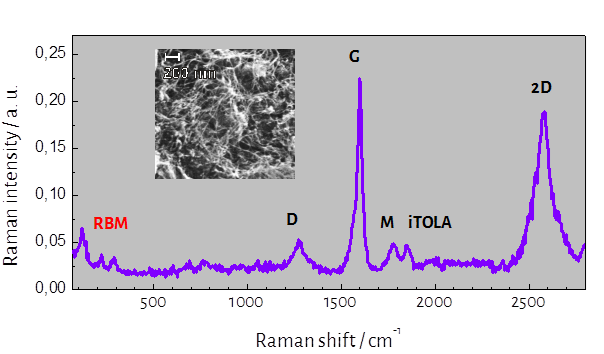
Single wall nanotubes delivered for tests had been grown with the use of CVD method. Tests on distribution of diameters of nanotubes were conducted as based on position of RGB strands found in the area of low frequencies, which result from Raman resonance effect with exciting radiation energy of 1.17 eV. The estimated distributions of diameters are within the range of 1.32 to 1.53. The nanotubes are not found as separate, but they are bonded into ropes with thicknesses from 10 to 15 nm, which are visible on SEM images (an insert to the figure). It results from the analysis of G line that the samples are dominated by chiral semi-conductive nanotubes. The presence of D line is connected with the presence amorphous phase of carbon. The tested nanotubes were not recommended for use as materials for production of paper for electrochemical applications.